How to Look at Data for SEO

”In God we trust. All others must bring data.” I first heard this quote when I was talking to a startup founder - always a refresher to speak to one, they always have the best mindset and ideas!
I’m a firm believer in using data, however, throughout my career I’ve noticed a few issues people need to know about using data. To use data correctly for SEO you need two things:
- Understand the role and type of data (what metrics)
- Establish efficient data analysis and reporting processes (frequency, format, etc…)
If you’re wondering how to use data for SEO, here’s a simple framework I recommend starting with.
The SEO Riddler Newsletter
Join the newsletter to receive the latest updates in your inbox.
How to Look at Data for SEO - A Framework

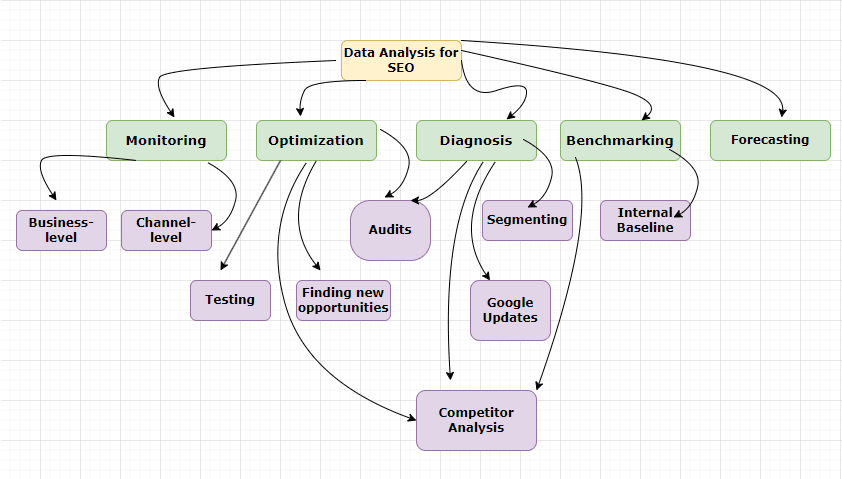
The framework in the diagram above divides data analysis for SEO by use case. We end up with 5 main buckets:
**Keep in mind that different metrics and KPIs can fall into more than one category and they can also differ based on business needs.
1# Monitoring
Think of this as your basic SEO reporting. I recommend you keep it simple. The frequency of reporting for monitoring purposes depends on your needs and the business’s, so this can be done weekly, bi-weekly, or monthly. Monitoring data for SEO comes in 2 layers:
- Business level data: for this type of reporting, you are focused - laser-focused - on how SEO is impacting the business directly. That’s why I recommend tracking business bottom-line KPIs and metrics. This simply means Traffic and conversions (product sales, signups, demos, contact sales forms, etc….). This is the type of reporting you can communicate to C-suite executives and other business stakeholders.
- Channel level data: This report can be as deep or high-level as you see fit for your role and the same for the frequency. This report can also include metrics that may not necessarily impact business goals directly and other technical metrics. Example of metrics to track for channel-level monitoring:
- Clicks
- Impressions
- Number of backlinks
- Number of indexed pages
- Rankings, etc…
The purpose of channel-level data monitoring is to have an understanding of the overall website health and performance from an SEO standpoint. Think of that when designing your reporting system and choosing metrics to track.
- Tip: you can set up Ahrefs or SEMrush to do periodic weekly crawls - or you can do that manually with screaming frog if you prefer - to monitor the technical health of the website and get notified of any indexation or major changes that occur. This has saved a website in the past when the dev team accidentally noidexed the entire website.
- To get an idea of what metrics you can report for SEO, check out this guide on input metrics.
2# Optimization
The heart and core of SEO work is optimizing. We need to look at the data we have to find ways we can optimize and improve our website’s performance. From experience, data is used in 3 main ways:
- Audits: These are mainly tech and content audits that you usually do at the start of your SEO engagement and then periodically (every quarter for example).
- Finding new opportunities: mainly keyword research which is done at the start of the engagement but is also an ongoing task, and finding new topics to target, in addition to finding opportunities to optimize existing pages.
- Testing: With the SERPs always changing and Google constantly rolling out updates, it’s important to always keep testing. I used SEOTesting tool in the past to conduct tests, here’s a list of some SEO tests ideas for you to try out. Just like keyword research, SEO testing is an ongoing task.
- Competitor Analysis: competitor analysis is more than essential in SEO. I recommend considering both your SERPs competitors and your business competitors. Some people do a competitor analysis as part of their “monitoring data” as well, so for example you can report monthly on traffic market share. Few tips when doing a competitor analysis:
- Know why you are tracking/looking at this data - because we look at data to inspire action - and what data you should look at.
- Understand that you are using third-party tools to get some ballpark or estimates on competitors’ performance (eg traffic) and therefore the data isn’t very accurate.
- If you’re comparing your traffic against the competitors, use the same tool and do not compare your internal traffic data from search console for example with competitors' traffic estimates from third-party tools.
- Some metrics are not worth comparing like DR for example. Make sure you are looking at meaningful data to guide action.
3# Diagnosis
When you’re monitoring your data, sometimes you notice unexpected numbers (positive or negative) and you’d like to know the cause. This is when Diagnostic data analysis comes in handy!
- Audits: Sometimes you are faced with performance issues and want to know the reason, or what is broken to fix. For example, post migrations, if you notice a big drop in traffic, that is a sign that you need to do a data analysis to diagnose what is wrong and get it addressed.
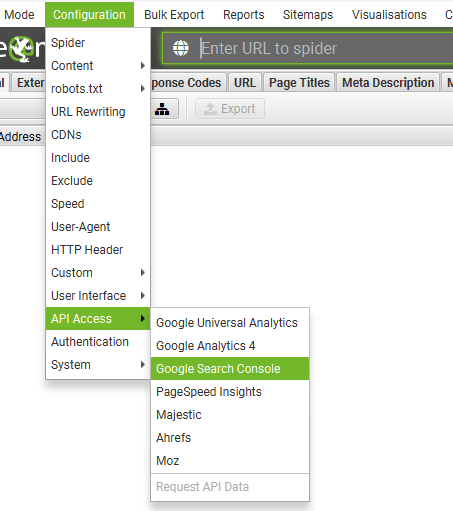
- Migration diagnosis tip: use screaming frog and GSC API to crawl performance data for URLs before the migration, and then crawl the performance data for the URLs - map the old to new URLs first - after the migration week by week to compare.

I had an E-commerce client in the past request a detailed report on the causes of traffic drop. For me, it was an easy answer without even looking at the data, this client has not been executing any SEO recommendations. SEO is not a one-and-done thing, it is ongoing and needs maintenance so if you’re not doing any work it is normal to lose traffic gradually. That said, I still did the report. One of the most efficient ways to diagnose performance issues on your website is to segment data.
- Segmentation: this means breaking down your data into smaller specific subsets. By channel for example and compare, did the drop happen only in SEO or did other channels also see a decline? By location, by mobile vs. desktop, etc… This can help you identify the source of the problem. Go deeper and more granular, look for patterns. You can also inspect data on the folder level, URL level, and keyword level. For the E-commerce client I mentioned above, one noticeable issue is a problem with a coupon code that impacted conversions. So here’s another lesson:
- I assumed that because the client was not executing any of the SEO recommendations, they started to lose traffic. This is correct, however, looking into the data I found more issues to raise. Don’t assume, always look at the data and double-check.
- Google Updates: of course sometimes your website performance is impacted by Google updates and you want to find out what you should change. I will not dig deeper into this, but here’s a great resource by Aleyda Solis on How to do a post Google Update SEO Analysis to recover lost rankings.
- Tip: ideally you need to wait at least a few days or a week to collect enough data in GSC to be able to analyze how and why your traffic was impacted. So don’t jump to conclusions right away.
- Competitor Analysis: in the context of diagnosis, competitor analysis is about looking for what changed in SERPs that have impacted your rankings or CTR. For example, if you notice a low CTR on your branded keywords, this can mean that there are PPC ads bidding on your brand keywords. I once had an e-commerce client that collaborated with resellers for their products. The resellers would bid with PPC ads on my client's brand name, I flagged this to my client so they could communicate with their resellers not to bid on brand names. (sometimes this may not be possible, but always worth a shot, and worth raising the issue to your client).
4# Benchmarking
Benchmarking is about comparing the performance of your website against others and sometimes against your website's performance in the past. In other words, you benchmark to see how your website measures against a standard you have set/identified at the beginning of the SEO engagement.
- Benchmarking against competitors and industry standards: this data can be used to get initial buy-in on why you need to do SEO. It can also be used to show how big the market is and the percentage of market share you own. Additionally, it is important to have this data at the beginning of your SEO strategy, to show progress as you start executing. (keep in mind all the tips mentioned above under optimization → competitor analysis)
- Internal baselines: this is very important in my opinion. Internal baselines is about understanding what is “normal” for your website in terms of traffic, conversions and other metrics. On average, how many clicks do you get per day during the week and during weekends, same for conversions. You need to know this data, so whenever something changes whether positively or negatively you can easily spot it right away.
- Tip: consider building a custom click curve for your website as this will help you understand (and predict) your performance better. Checkout this guide on how to create custom click curves by Kevin Indig.
5# Forecasting
One of the complicated tasks in SEO is to forecast the impact of your SEO strategy. The go-to formula is:
Notes:
- You usually need to forecast to get buy-in for your SEO strategy, so this usually happens at the beginning of the SEO engagement and every time you propose a new strategy.
- This formula will be slightly different depending on your business.
- You can either use the CTR from the AWR CTR study or from your custom click curve that you created which is better because it’s more accurate
- Sometimes, if you’re trying to improve rankings for keywords you are already ranking for, you can use the number of impressions in GSC instead of estimated search volume from third-party SEO tools.
The SEO Riddler Newsletter
Join the newsletter to receive the latest updates in your inbox.
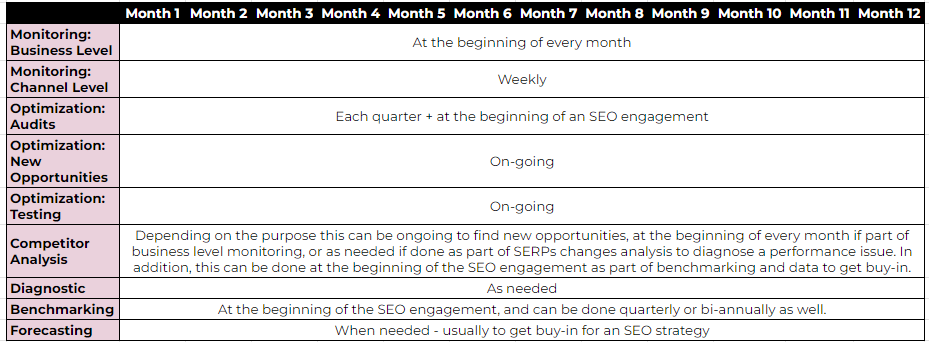
How to Create a System for Data Analysis?
As I mentioned at the beginning of this blog, to use data efficiently, we need to Understand the role and type of data (what metrics) we need, and establish efficient data analysis and reporting processes (frequency, format, etc…)
Here’s a proposed plan that you can adapt to your business needs, outlining when and what type of data analysis do you need:

Last Words…
I’ve discussed this issue previously in an article I wrote in SEL “Top 5 SEO data pitfalls to avoid for accurate analysis and reporting”. I’ve also discussed one of the issues with MOM SEO reporting before. But here are more tips to get you started with data analysis for SEO THE RIGHT WAY!
1# Avoid Analysis Paralysis
Leveraging data is important, but knowing what is enough is also more important. You can easily get sucked into an infinite loop of analyzing data. We are not in the business of selling reports, we are trying to get data to inspire and guide actions. Just because you have access to 15 data sources, does not mean you need to use the 15 data sources. More data is not always better, sometimes less is more.
2# Always Start With a Question
It’s always great to start by defining why you are looking at data, and what you are looking for. What does the answer you’re looking for look like? Begin with the end in mind. This will help you identify what metrics to look at and what is relevant and what is not. It’s also important to know why this question will help improve SEO performance and business goals. This is very important to avoid going on useless data hunts. For example:
- A question can be “Why is the CTR for this URL low despite ranking 5th?”
- Information that is relevant to answering this question: meta titles, meta description (possibly), schema, SERP competitors, etc…
- An answer can look like this: “Our title tag needs to be optimized for better CTR”
The SEO Riddler Newsletter
Join the newsletter to receive the latest updates in your inbox.


